
So many people want to know how to trade gold and to be honest, if you're patient enough to wait for a buy signal and low-risk setup, then trading gold can really pay off with only a few trades. This report shows a couple charts that I follow to help time my trades. My trading model allows us to trade any sector, but I prefer to trade gold and oil because of the accuracy that they have provided in the past.
Trading with the Bullish Percent Index (BP)
The BP chart is great for finding overall trends in a sector. I focus on the trend and try to find patterns/cycles to help time pivot points for trading gold and gold stocks. Each sector has its own cycle length so do not try applying the same cycles to different sectors.
The chart below clearly shows the gold miners BP chart, which has been in a strong up trend since December. The current cycle has just turned up for the gold index indicating we could see higher prices this week.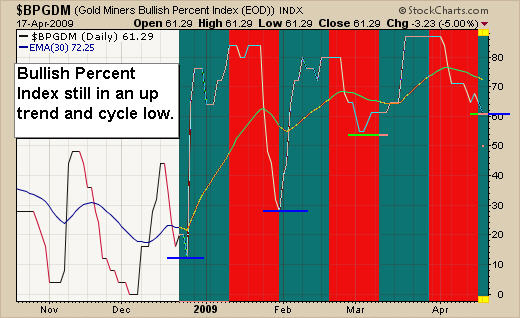
The Gold Bugs Index (Gold Stocks)
Trading gold stocks is a very exciting and profitable niche to trade. I have traded many other sectors and the top two sectors I specialize in are Gold and Oil (energy).
Trading using technical analysis is my strong point. I combine multiple time frames, trend lines, momentum, commitment of traders (COT) and several other inter-market relationship trading vehicles. After analyzing this information very accurate trading signals can be generated.
Trading gold stocks using a proven trading model and risk management helps to keep trading signals black and white taking the guesswork out of trading. The chart below shows that gold stocks are near a support level and when you combine this with the BP chart above which just turned positive I know I can start looking for some potential long positions in gold of gold stocks if we do happen to get a strong reversal to the upside.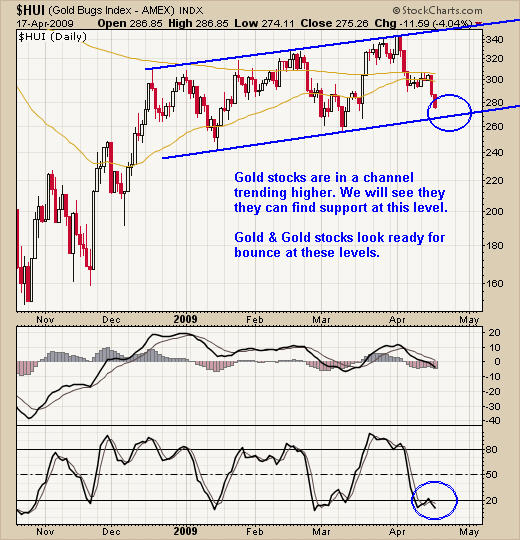
How To Trade Gold (GLD ETF)
Gold is currently trading at a pivot point and will most likely make a sharp move higher or lower from here. This has many traders on edge right now. I prefer to stay in cash during times like this and jump on the wagon once a direction has been confirmed and I have a low risk setup.
What Makes this a Pivot Point?
1. Currently at the December highs which could act as support
2. Gold has formed a Head & Shoulders pattern and broken the neck line
3. The current pull back looks like a simple ABC retrace before moving higher
4. Gold is currently trading at the 200 day moving average which could be support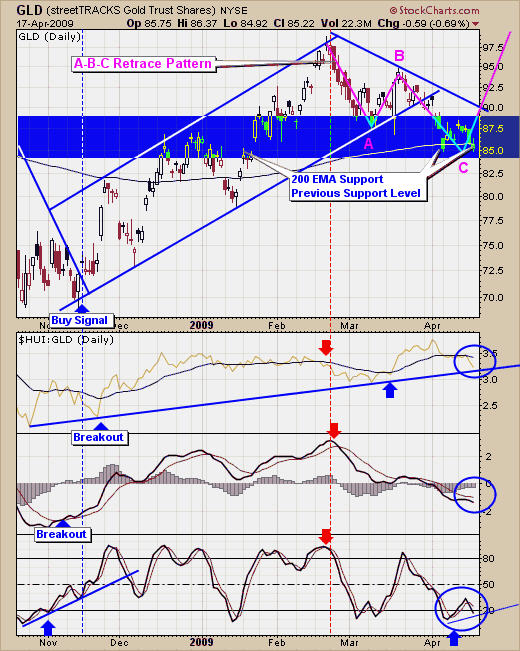
How To Trade Gold & Gold Stocks – Trading Conclusion
Learning how to trade gold and gold stocks can be done very easily if you know what to look for and have patience. I don’t trade gold every week but that’s what I really like about my trading model. It’s simple and I don’t have to be glued to the computer every day.
I can quickly look at the charts and know if I could have a potential buy or sell signal within a few days. If I do then I watch the charts, if not I focus on answering my members' trading emails and look for other possible trades in other sectors like the Nat Gas and Russell 2000, etc…
As you can see from the charts above, gold is at a crucial pivot point and only time will tell before we know where gold is headed. Once we have a direction I will be looking for a low risk setup, which is a trade with less than 3% downside risk, for putting our money to work.
If you would like to receive my Free Gold & Energy Trading Reports and Signals please visit my website: www.GoldAndOilGuy.com


