
In Part 1, we identified 79 MLPs by primary business activity. That list includes all 50 of the largest MLPs, which are constituents of the Alerian MLP index.
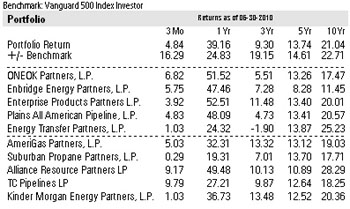
We developed this view by identifying the 10 largest MLPs in the Alerian MLP index, which also had 10 years of data, then created a hypothetical equal weighted portfolio of those MLPs for comparison to stocks and bonds. Those 10 MLPs in the portfolio have symbols (in alphabetic order): ARLP, APU, EEP, ETP, EPD, KMP, OKS, PAA, SPH and TCLP.
This table shows the total return for the hypothetical portfolio vs. S&P500 index as represented by Vanguard's S&P 500 fund (VFINX). The total return data assume monthly rebalancing of the portfolio to equal weighting of the MLPs. Over all periods, the MLPs had a higher total return.
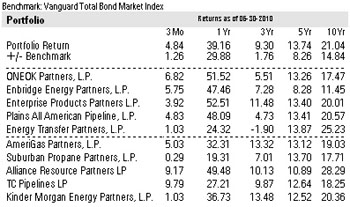
This table shows the total return for the hypothetical portfolio versus the Barclay's Aggregate Bond index as represented by Vanguard's Total Bond Fund (VBMFX). The total return data assume monthly rebalancing of the portfolio to equal weighting of the MLPs. Over all periods the MLPs had a higher total return.
In addition to superior total return, MLPs generated less severe "worst" 3-month, 1-year and 3-year periods than stocks. On the other hand, MLPs generated much larger value drawdowns than bonds.
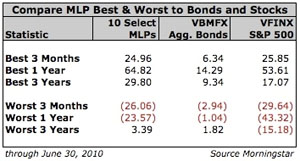
While MLPs generated higher total returns than stocks or bonds, they exhibited standard deviations roughly equal to the standard deviation of stocks. They are volatile.

The 12-month trailing yield on the hypothetical portfolio as of June 30 was, 6.88% vs. 2.20% for VFINX and 3.62% for VBMFX.
You might want to include MLPs in your portfolio for current yield or total return, but must expect much higher volatility than from bonds.
We developed this view by identifying the 10 largest MLPs in the Alerian MLP index, which also had 10 years of data, then created a hypothetical equal weighted portfolio of those MLPs for comparison to stocks and bonds. Those 10 MLPs in the portfolio have symbols (in alphabetic order): ARLP, APU, EEP, ETP, EPD, KMP, OKS, PAA, SPH and TCLP.
This table shows the total return for the hypothetical portfolio vs. S&P500 index as represented by Vanguard's S&P 500 fund (VFINX). The total return data assume monthly rebalancing of the portfolio to equal weighting of the MLPs. Over all periods, the MLPs had a higher total return.
This table shows the total return for the hypothetical portfolio versus the Barclay's Aggregate Bond index as represented by Vanguard's Total Bond Fund (VBMFX). The total return data assume monthly rebalancing of the portfolio to equal weighting of the MLPs. Over all periods the MLPs had a higher total return.
In addition to superior total return, MLPs generated less severe "worst" 3-month, 1-year and 3-year periods than stocks. On the other hand, MLPs generated much larger value drawdowns than bonds.
While MLPs generated higher total returns than stocks or bonds, they exhibited standard deviations roughly equal to the standard deviation of stocks. They are volatile.
The 12-month trailing yield on the hypothetical portfolio as of June 30 was, 6.88% vs. 2.20% for VFINX and 3.62% for VBMFX.
You might want to include MLPs in your portfolio for current yield or total return, but must expect much higher volatility than from bonds.


