
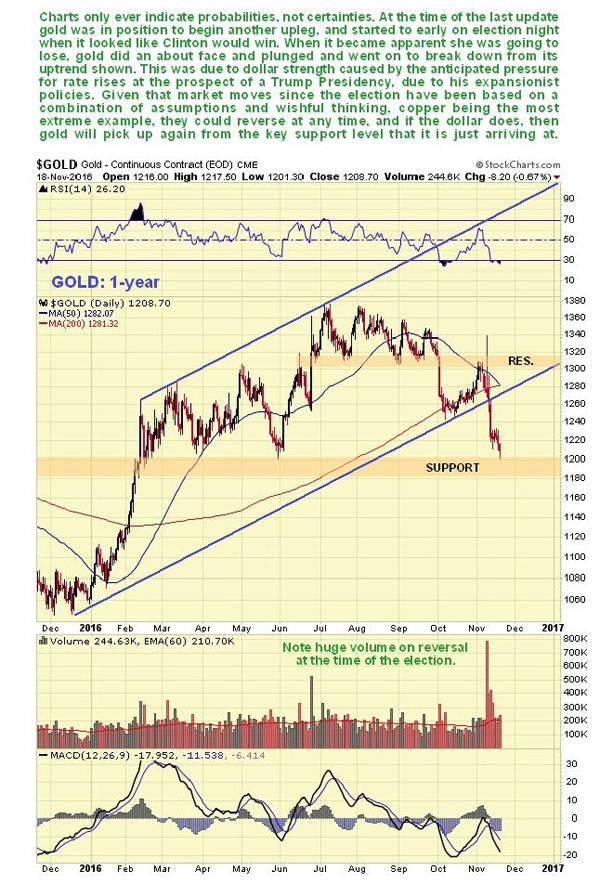
Charts only ever indicate probabilities, not certainties. At the time of the last update, gold was setting up for another upleg within the uptrend shown on our 1-year chart below, but this was predicated upon the expected Clinton victory. So when Trump won instead, this scenario aborted. Observe how, early on election night, when the markets assumed Clinton would win, gold was up sharply, but by the end of the night it had reversed sharply on heavy turnover, and it went on to break down from the uptrend and head steeply lower toward the important support level shown, which it started to arrive at on Friday.
Fundamentally, the reason for gold heading sharply lower on a Trump win was not the possibility of Trump melting down Trump Tower and casting it into gold ingots to dump on the market, but the prospect of Trump's ambitious and expansionary policies driving up interest rates. This had the immediate effect of driving the dollar higher, but given that sharp moves across markets since the election have been based on a combination of assumptions and wishful thinking, they could go into reverse very quickly. With the dollar hitting a target late last week, gold has a good chance of turning up from the support in the $1,180–1,210 zone.
It is widely assumed that because Trump won the election by a clear majority (of electoral votes), he has "carte blanche" to fulfill his election pledges as he wishes, but there are powerful vested interests standing in his way who will make their presence felt, which is a reason some of the post-election trends may go into reverse.
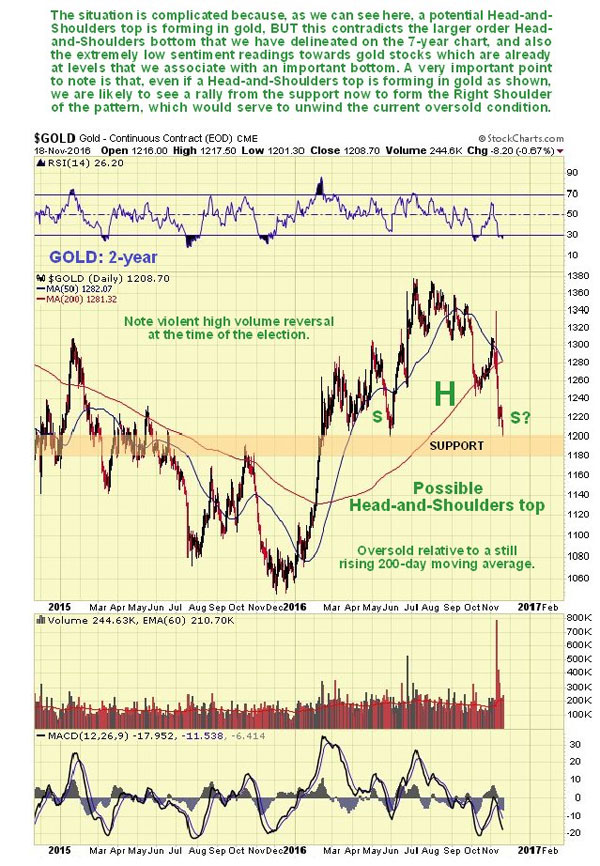
It is interesting to look at gold on a 2-year chart, because we can see that gold may be in the process of forming a head-and-shoulders top at the support level. However, this scenario is considered less likely because of a larger order head-and-shoulders bottom that we will look at shortly on gold's 7-year chart, and because gold stock sentiment is already at the abysmal levels that are associated with an important bottom.
Even if gold is actually marking out head-and-shoulders top, the probability is high that it will rally to about the $1,280 level to form a right shoulder to the pattern, which would serve to unwind the oversold condition before it later breaks down.
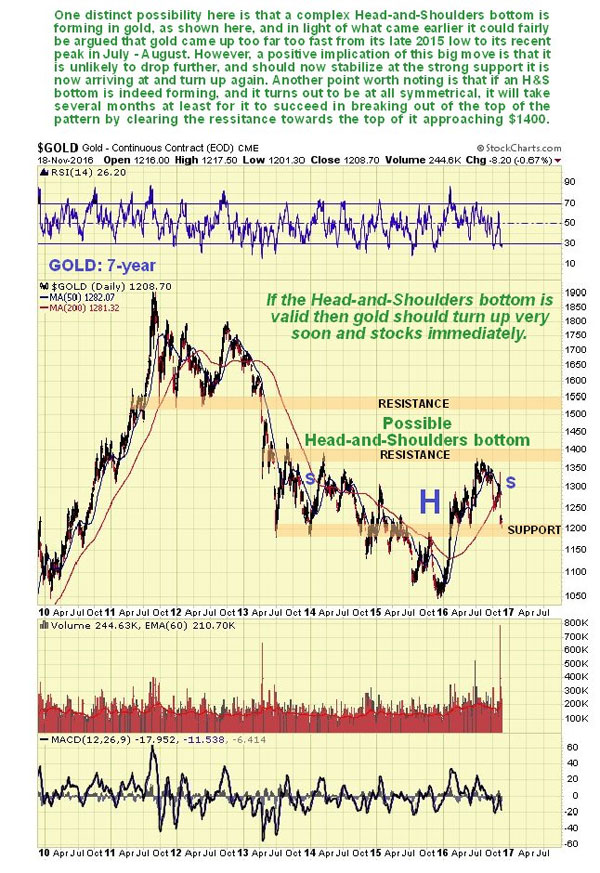
Proceeding to the 7-year chart, we see that a larger order complex head-and-shoulders bottom may be forming in gold. If so, the retreat of recent weeks signifies it dropping down to form the right shoulder of the pattern. If this interpretation is correct then, given the tendency of these patterns to symmetry, it is likely to take some months of building out the right shoulder before gold is ready to advance out of the pattern, breaking above the resistance at the top toward and at $1,400. The big advance from the late-2015 low to the peak last July–August certainly has bullish implications, and increases the probability that gold is turning into a bull market.
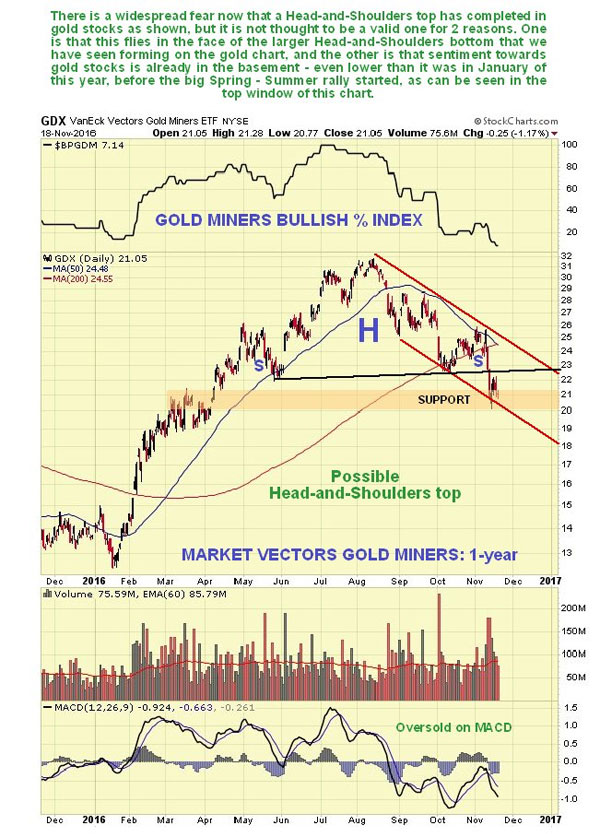
The breakdowns by gold and silver naturally had a big impact on mining stocks, which fell hard, as we can see on the 1-year chart for GDX shown below.
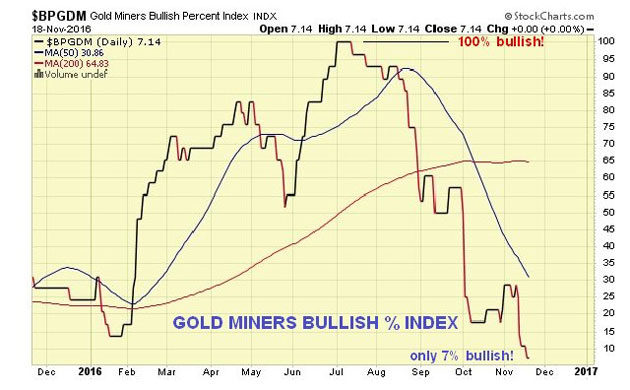
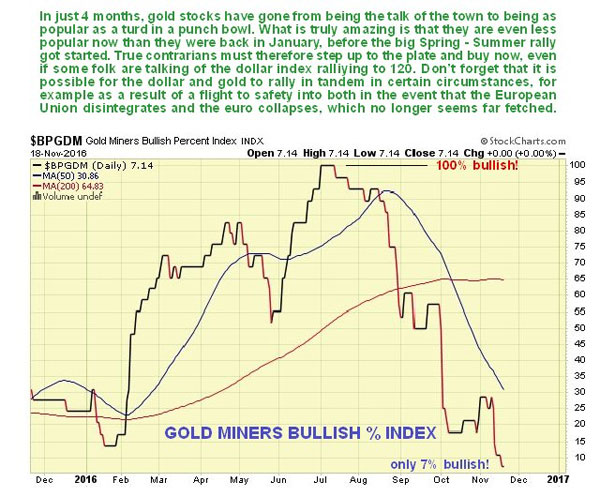
There is a widespread fear now that GDX and various indices have broken down from a head-and-shoulders top, but it is not thought to be a valid one for two main reasons. One is that this flies in the face of the larger-order head-and-shoulders bottom that we have observed on the 7-year chart for gold, and the other is that sentiment toward gold stocks is already close to rock bottom—just 7% bullish compared to 100% at the beginning of July.
This reading, which we can see on the Gold Miners Bullish Percent Index chart below, is even lower than just before the huge sector rally that started in January of this year, when it was at about 13%. This strongly suggests that GDX will turn up from the strong support level that it is currently dug into.
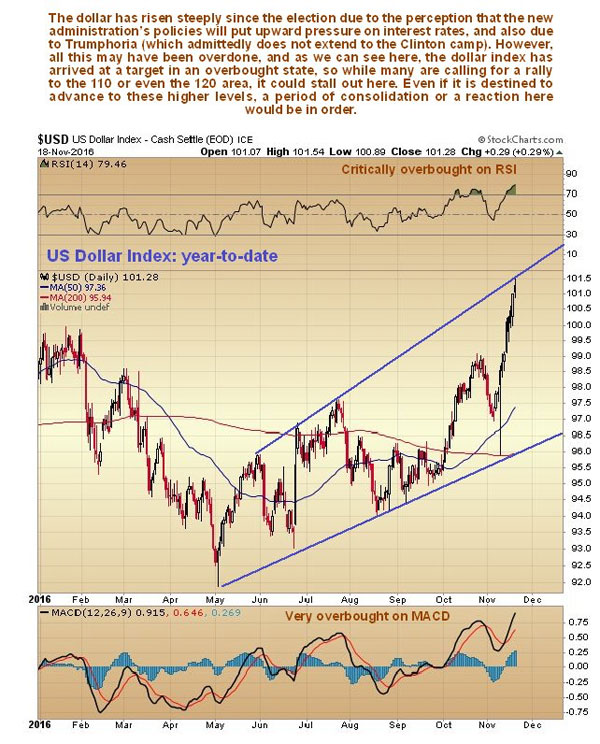
The dollar did an about face and went storming up on the Trump win, for the reasons set out above—chiefly the increased chance of higher interest rates, as we can see on the year-to-date chart below.
Many are now calling for a big rally to the 110 or even 120 area. While this could yet occur, it is sobering to observe that the dollar has arrived at a target in a very overbought state, and given that simplistic assumptions about a Trump presidency could soon give way to serious doubts, it is conceivable that the dollar is at a top here. Even if it is destined to continue to 110 or 120, it would be in order for it to stop for a rest here and consolidate or react somewhat.
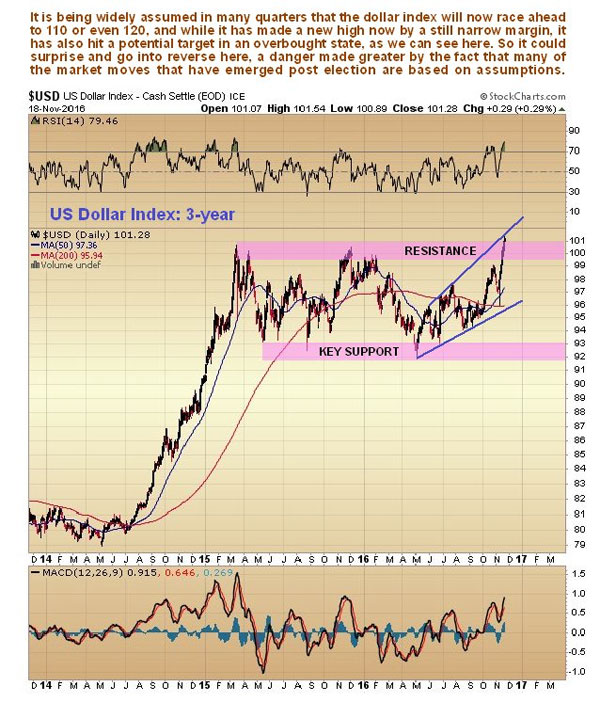
The dollar index has made new highs, as has been widely TRUMPeted in the media. But as we can see on its 3-year chart, these new highs are still marginal. The fact that it is at a target and still within grabbing range of the resistance shown, and is overbought, increases the risk that it will slump back into the giant trading range. If it does it will trigger a rebound in the precious metals sector. This could be the most important message being telegraphed by the extremely low Gold Miners Bullish Percent Index.
Clive Maund has been president of www.clivemaund.com, a successful resource sector website, since its inception in 2003. He has 30 years' experience in technical analysis and has worked for banks, commodity brokers and stockbrokers in the City of London. He holds a Diploma in Technical Analysis from the UK Society of Technical Analysts.
Want to read more Gold Report articles like this? Sign up for our free e-newsletter, and you'll learn when new articles have been published. To see recent articles with industry analysts and commentators, visit our Streetwise Interviews page.
Disclosure:
1) Statements and opinions expressed are the opinions of Clive Maund and not of Streetwise Reports or its officers. Clive Maund is wholly responsible for the validity of the statements. Streetwise Reports was not involved in the content preparation. Clive Maund was not paid by Streetwise Reports LLC for this article. Streetwise Reports was not paid by the author to publish or syndicate this article.
2) This article does not constitute investment advice. Each reader is encouraged to consult with his or her individual financial professional and any action a reader takes as a result of information presented here is his or her own responsibility. By opening this page, each reader accepts and agrees to Streetwise Reports' terms of use and full legal disclaimer. This article is not a solicitation for investment. Streetwise Reports does not render general or specific investment advice and the information on Streetwise Reports should not be considered a recommendation to buy or sell any security. Streetwise Reports does not endorse or recommend the business, products, services or securities of any company mentioned on Streetwise Reports.
Charts provided by Clive Maund


